
Jira is popular with project managers, developers and QA experts because of its project management capabilities and task tracking features. For QA professionals, the tool provides the opportunity to develop and track both user stories and bug tickets. Jira also offers exceptional collaboration features that benefit all members of a software development team.
What's the problem then? It’s that Jira isn’t designed to offer test case management. Although many teams use it to track defects and manage ongoing testing efforts, it’s not optimal for test development or execution tracking. However, Jira does offer an add-on for a test case management tool called Zephyr, which brings plenty of features that compensate for the missing test management capabilities in Jira, as well as the reporting functionality.
Zephyr for Jira
Zephyr was built for test case management — it leverages Jira’s bug-tracking features to manage test cases and execution. This plug-in tool facilitates work between developers, QA, and product/project managers in real time, and also supports monitoring and updates for builds and test execution status.
Although Zephyr has limited reporting ability within Jira, test case planning and execution is fully integrated with Jira bug tickets. This tool will save a team time by automatically identifying tests that need to be re-executed after a defect is fixed, plus other helpful features.
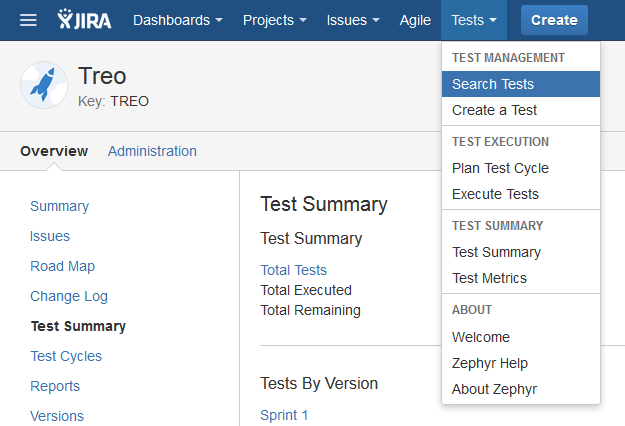
After installing the Zephyr plugin, a Tests menu displays on the top menu bar. When expanded, the drop-down displays a list of actions available. The options include Creation, Execution, Management, Test Summary, and Test Metrics.
In 2023, Zephyr released a mobile app version of their testing platform, allowing testers flexibility for developing tests and performing device testing. This may be a useful consideration if testers are working remotely, or across time zones and need to test on a mobile device.
Creating Tests with Jira
In Jira, test case creation is initiated by using the Create button on the top right side of the screen. The tester then uses a preset task type that contains typical fields the team associates with a test story in Jira. Testers fill in the steps, add screenshots or other documentation and save. The most critical step is ensuring the test case story is saved in the correct location where other testers or development team members can quickly find them.
When creating test cases using Zephyr, testers must use a tool outside of the Jira task board. Each test is created as a unique entity and stored in Zephyr. Writing tests in Zephyr provides the following benefits:
- Ability to add comments
- Ability to create test cycles or regression suites
- Ability to assign testing cases to specific testing cycles
- Link the test cases to Jira stories or defect tasks
- Test cases can be cloned and edited to save on test development time
- Test cycles or regression suites can be cloned saving time creating test suites for ongoing testing cycles
- Searching for tests is simpler and more effective
- Enables testers to import existing tests created in Excel
- Provides status tracking and built-in reporting for test reporting
Planning the Test Cycle
Zephyr allows users to create multiple test cycles, then view them under specific versions. Tests can be added individually to an existing cycle, or cloned as a group from another cycle. Once all tests are added to the test cycle, the execution phase is organized — tracking results becomes simple. During execution a progress tracking bar displays tests executed and those remaining as a percentage. After a cycle completes, then testers can create the next test cycle and clone all desired tests saving time when building suites for the next testing cycle. The next version test suite is ready for the next release.
Executing the Tests
This option allows the user to execute any test case after accessing its test cycle. Users can run the test immediately or include it in an existing test cycle. The execution and tracking of tests is easier when tests are grouped under test cycles.
Reporting using Zephyr and Jira
Test Summary and Metrics
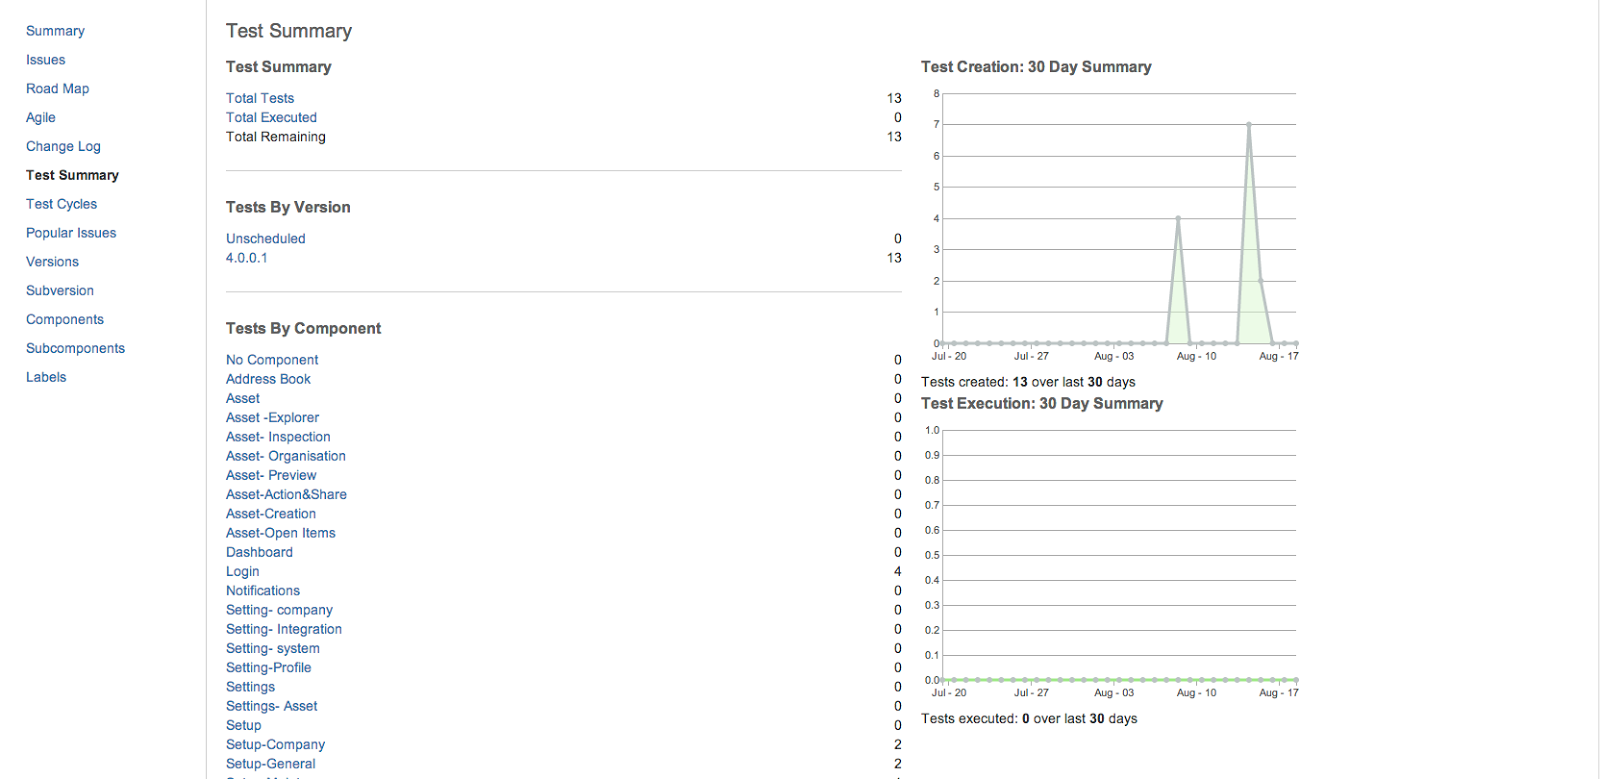
Zephyr has a basic reporting scheme — the number of total tests executed and the tests remaining in a project can be seen in the test summary. The tests can also be displayed based on the version or any other Jira label where they are grouped.
Use the Test Metrics option on the Tests tab to display the current status of a project. Users may improve the visual display by choosing a pie chart or graph. Metrics can be customized to reflect the test execution status of a particular version or for a specific time period. Jira makes the task of issue reporting easier for QA engineers by including additional formatting features. The following screenshot shows the issue screen in Jira. Formatting features are available in the Description field:
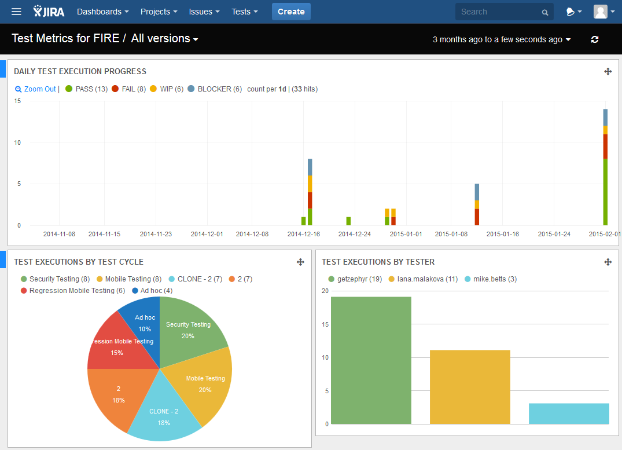
The ‘Test Metrics’ option in the ‘Tests’ tab displays the current status of your project with the help of pie charts and graphs, listing the execution details by day, by test cycles or by the name of a particular tester so that their output can be monitored. The test metrics can be customized to reflect the test execution status of a particular version or for a specific time period.
Issue reporting with JIRA formatting features
Jira makes the task of issue reporting easier for QA engineers by including additional formatting features. The following screenshot shows the issue screen in Jira. Formatting features are available in the Description field:
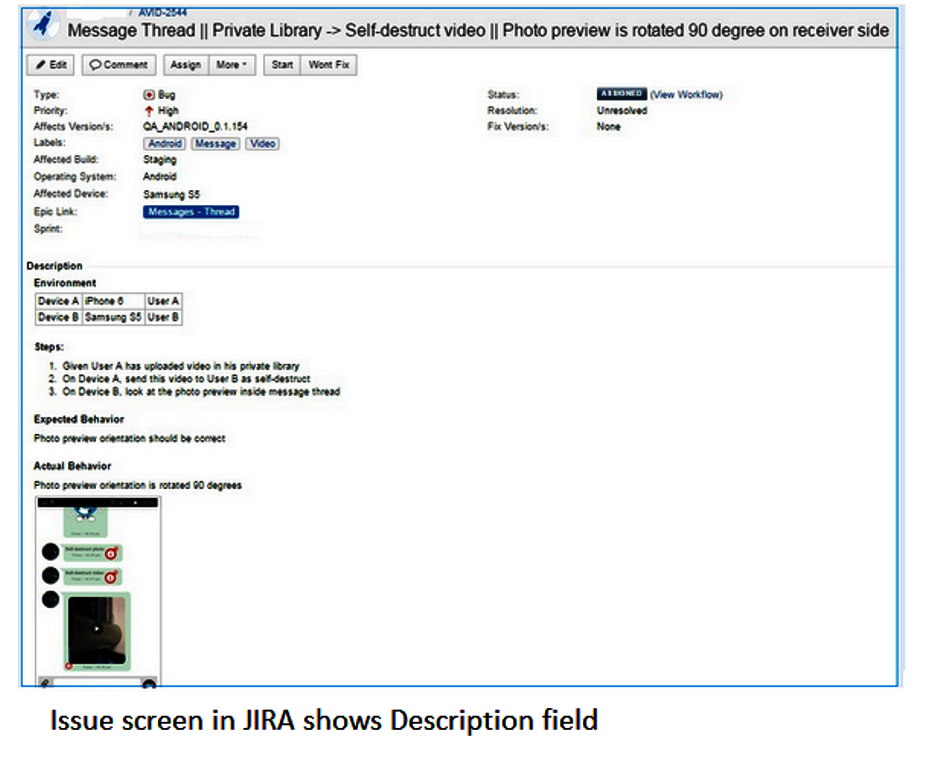
While documenting the issue in the description field, the QA engineer must clearly convey the following information:
- The issue.
The syntax behind it dictates the table appearance. For a header, use the h4 command at the beginning of the line, followed by the header text (such as the word Environment). Headers can be placed in the description by writing h{n}. at the beginning of the line followed by the header text (where n is a number from 1 to 6 in decreasing order of font size).
To add tables to a description, use vertical bars (||) to enclose table headers and to enclose column text.
In the previous example, the syntax for the table is:
|Device A|iPhone 6|User A|
|Device B|Samsung S5|User B|
- How to reproduce the issue.
To fix the issue, the developers will need to reproduce it. You can use numbered lists to outline those steps and make it easier for them to do so.
To create numbered list, use the pound or hash symbol (#) in the first space of the syntax. And, if you need to insert any step into the list later on, JIRA helps you out by automatically re-adjusting the order of list numbers.
In the example, the syntax for the steps is:
# Given User A has uploaded video in his private library
# On Device A, send this video to User B as self-destruct
# On Device B, look at the photo preview inside message thread
If you want to create a bulleted list, you can use an asterisk (*) in the first space of the line. For further indentation, use two asterisks (**).
- What is the expected behavior?
As a QA engineer, you should describe what the application component is expected to do as part of the issue documentation. Whenever possible, provide a link to the relevant section in the specification documentation.
- What is the actual behavior?
To draw attention to an attribute, you can use syntax to highlight it in bold using an asterisk (*) or italics , use underscore (_) or even choose to display it in a different color.
Whenever possible, you should attach test evidence like an image or a video to show the actual behavior of the component. JIRA provides an image-capturing tool called JIRA Capture for web application testing. To use this tool, the URL address of the image is enclosed within ! in the syntax within the Description.
The URL address is further enclosed within the vertical bar (|) symbol so that the image is displayed within a box conforming to its dimensions. The syntax can be something like this :
http://jira.onpathtesting.com:8080/secure/attachment/12747/Screenshot_2015-04-30-18-08-31.png|height=300|width=150!|
Notice that the syntax of these features is easy to comprehend and use. The clearer the documentation, the better the developers can understand and resolve issues. For assistance or more information on Jira formatting, visit Jira support.
Reporting metrics on the JIRA dashboard
The Jira dashboard provides easy-to-view statistics for fields such as projects, versions, and users. Each can be filtered and expressed graphically. Jira refers to these charts and data items as Gadgets, which can be customized by their placement on the page as well as appearance and behavior. Consider setting an auto-refresh time period for a gadget to eliminate the need to manually query or refresh in order to see the latest results.
The gadgets available on the Jira dashboard can help QA prepare a variety of reports including:
- Average Age Report: This report is expressed in the form of a bar chart showing the average duration (in days) for which issues remained unresolved at particular points in time. Looking at the average age report gives the QA team and the management a very good idea of the health of the project, and raise appropriate concerns if necessary.
- Pie Chart Report: This report displays the issues of a project filtered by a query in the form of a pie chart. It is useful as a high-level overview of the current build, helping to keep track of progress, assess workloads and even the performance of team members.
- Heat Maps: This is a dashboard gadget which is easy on the eyes. What the user sees are the values of an issue key grouped according to a query. They are grouped on the Dashboard according to the number of the issues under each Label. This results in a larger font size for a Label with a higher count, and progressively smaller font sizes for Labels with smaller counts. Along with visual graphs, heat maps are helpful in quickly determining that responsibility is fairly distributed among the team members as new sprints and projects are taken up.
- Created Vs. Resolved Report: With this report, you can view the number of issues created - and those which were resolved - during a specific time period. The health and progress of the project can be easily assessed using this report, and is ideal for giving feedback to management about the pace of work on both the QA and developer end.
-
Activity Stream Gadget: This dashboard gadget displays all the recent activity in all active projects by default. It can be customized to display information filtered by project, issue key or username to narrow the data displayed. The activity of more than one user also can be monitored by specifying their names in the “Apply Filters” field.
Whether it's cloud testing, automated testing, functional testing or regression testing, software quality assurance work takes significant time, effort and attention to detail. With some basic knowledge of metrics to watch for, though, there is every reason why any team should be successful at it.
Limitations of Zephyr
Zephyr has many benefits but also a few important limitations to mention when considering Zephyr as a test case management tool.
Spreadsheets win for efficiency
Writing test cases is more efficient in Excel than Zephyr. One option is to create test cases as a spreadsheet and then import it into Zephyr for life cycle management. The test cases can be edited within the tool as updates occur and test execution status changes.
Issues with rapid editing
Rapid editing is inefficient. Each edit must be individually saved and keyboard tabbed multiple times to get to the next/previous row.
Grouping problems
There is no feature in Zephyr to group together and list all the test cases which are linked to the same issue. If a bug ticket is related to a handful of tests, there’s not a simple method to view and execute each of these tests again.
Historical reporting lacks some granularity
The status of a single test case execution across multiple application versions cannot be displayed in a report or query. For example, if a regression test effort crosses multiple app versions, the results of these individual tests and test cycles will appear across all versions. It’s difficult to determine the test case’s execution history for strategically planning future testing suites.
Visualization and new cycles
Although there is a way to see a specific list of tests there is no way to add them as a group to a test cycle for future execution. The QA engineer must manually note each test and individually add them to another cycle. Additionally, when writing test cases, images cannot be linked to specific test steps.
Field values change in the reporting when updated
Field values are tied to the actual test case ticket and not to the test ticket in relation to a given test run or test cycle. Any history reporting is automatically updated with the latest values.
So, is Zephyr worth it?
Using the Zephyr plug-in for Jira can be a great way for QA, project managers, and developers to manage and monitor tests and execution status, however the tool’s limitations must be taken into account and understood to get the maximum benefit. The ability to create test status and progress reports is an important feature for increasing QA productivity by eliminating the time required to manually create reports for management.
Clear Captions Case Study
Read OnPath’s ClearCaptions case study to see how strategic testing accelerated growth and reduced release risk for a high-stakes accessibility product.
